Category Archives: MeRC

Kaptive – How novel searches within bacterial genomic data are presented and hosted on R@CMon

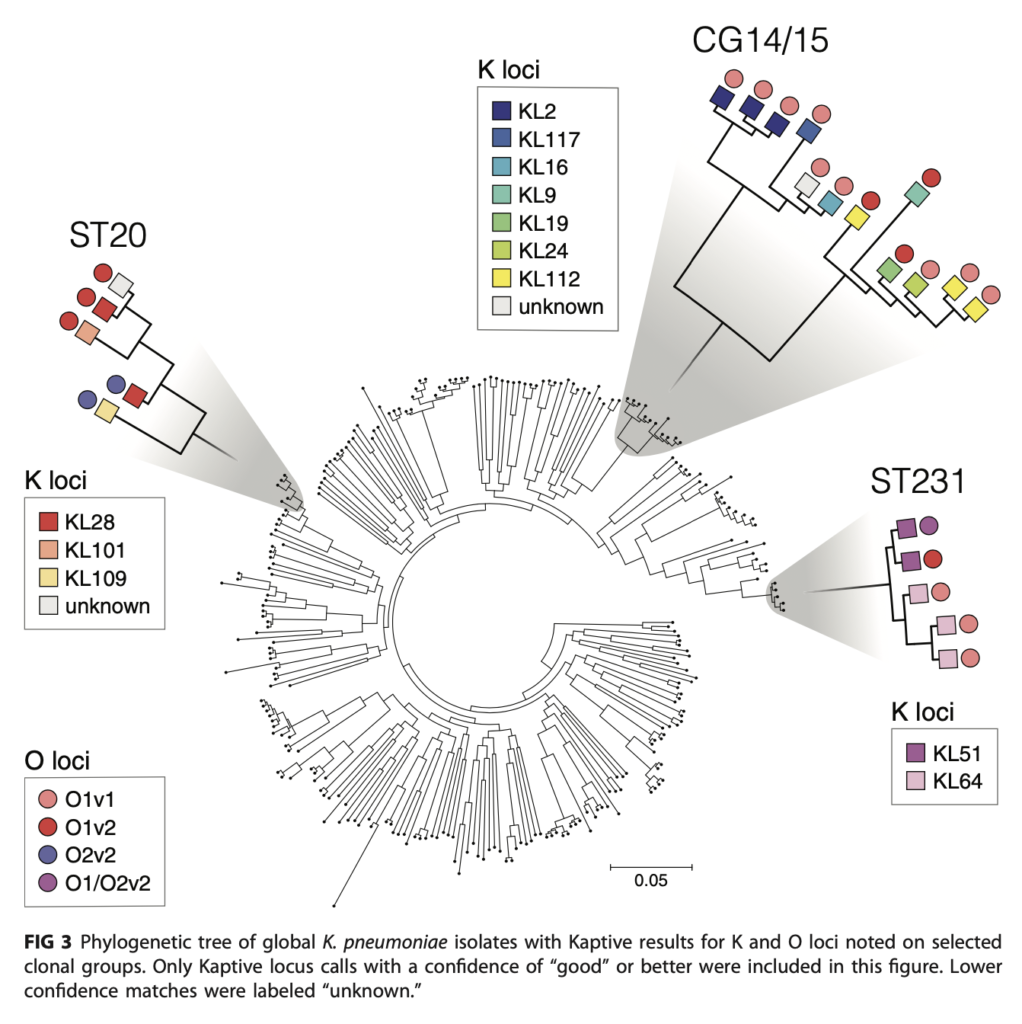
Dr. Kelly Wyres is a research fellow in the Holt Lab. Kelly first approached the Research Cloud at Monash team in 2019. She sought assistance to migrate their bioinformatics web application – Kaptive to Monash infrastructure. Kaptive is a user-friendly tool for finding known loci within one or more pre-assembled genomes, specifically for the identification of Klebsiella surface polysaccharide loci. It presents these results in a novel and intuitive web interface, helping the user to rapidly gain confidence in locus matches. Kaptive has been developed and currently maintained by Kelly Wyres, Ryan Wick and Kathryn Holt at Monash University. It also uses bacterial reference databases that are carefully curated by Kelly Wyres and Johanna Kenyon from Queensland University of Technology.

Wick RR, Heinz E, Holt KE and Wyres KL 2018. Kaptive Web: user-friendly capsule and lipopolysaccharide serotype prediction for Klebsiella genomes. Journal of Clinical Microbiology: 56(6). e00197-18

The R@CMon team provided its standard LAMP platform to host Kaptive on the Research Cloud. This included helping Kelly transition Kaptive from its original web2py mechanism (to quickly create web applications), to a production grade LAMP stack including a dedicated web server and storage backend. Now transitioned, the team can efficiently and effectively cooperate with Kaptive alongside a critical mass of other domain-specific LAMP based applications across all disciplines of research. The team also assisted in applying additional security controls (e.g HTTPS/SSL, reCAPTCHA) on the server to improve its security posture. As a measure of impact, more than 3000 searches (and associated computing jobs) have been submitted into Kaptive to date. As new reference databases become ready and curated, it’ll then be incorporated into Kaptive and made available to the research community.

This article can also be found, published created commons here 1.

Co-designing clouds for the data future of fintech : the next generation of StockPrice infrastructure

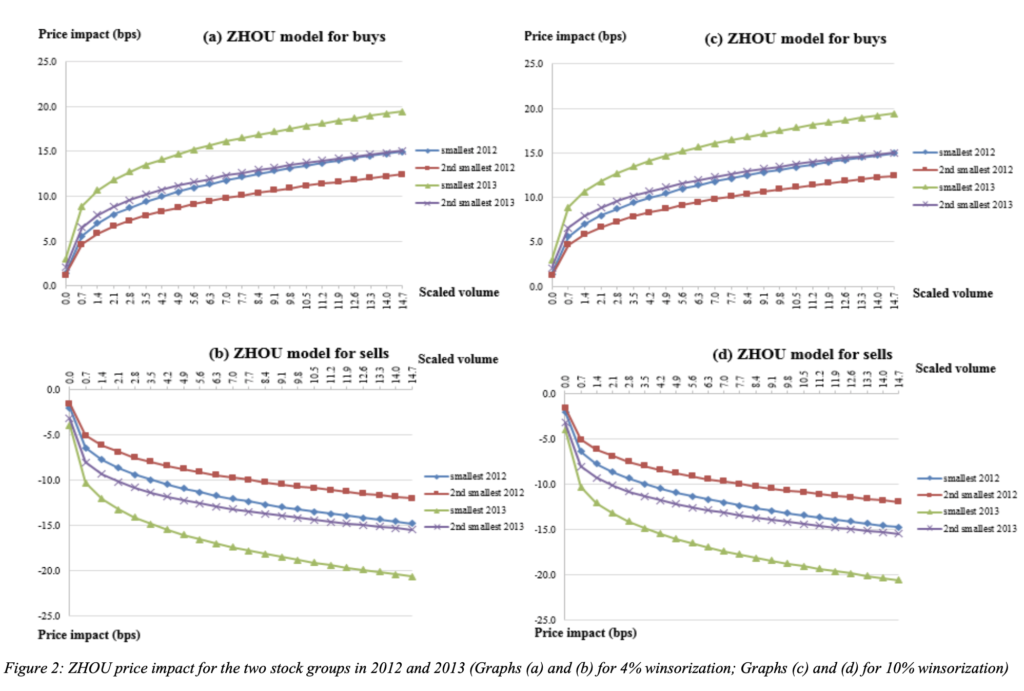
We first discussed the emergence of “big data”, and its impact on computing and storage needs, with Associate Professor Paul Lajbcygier and his team in 2014. The Research Cloud at Monash initial engagement enabled the “Stock Price Impact Models Study” to get off the ground with immediate high-impact research output. A few months later, in 2015, we’ve showcased their incremental update to the study “Stock Price Impact Models Study on R@CMon Phase 2 (Update)”, which produced another high-impact publication. Then in 2018, Associate Professor Paul Lajbcygier and Senior Lecturer Huu Nhan Duong held the “Monash workshop on financial markets” at the Monash University, attracting highly prominent Australian and international researchers to talk about topics such as “market design and quality”; “high frequency trading”; “volatility and liquidity modelling”; and many more.

Pham, Manh Cuong and Duong, Huu Nhan and Lajbcygier, Paul, A Comparison of the Forecasting Ability of Immediate Price Impact Models (September 18, 2015). Available at SSRN: https://ssrn.com/abstract=2515667 or http://dx.doi.org/10.2139/ssrn.2515667

Fast forward to 2020 and despite the current world and local circumstances, Paul and his team continue to excel in producing more high impact research outcomes. Their recent successes include a “Journal of Economic Dynamics and Control” publication entitled “The effects of trade size and market depth on immediate price impact in a limit order book market” and an Interfaculty Seeding Grant with the Monash Business School and Faculty of Information Technology to study high frequency trading using machine learning methodologies. There are also numerous research outputs to be submitted towards the end of 2020 and many more towards Q1 of 2021. This surge in high impact outputs correlates to a recent optimisation in the way big queries are executed on the memory engine of the underlying R@CMon-hosted database.

The speed up compared to previous data runs is around four times. This means we can now use more of the memory in the big memory machine effectively.

Paul Lajbcygier, Associate Professor, Banking & Finance, Monash Data Futures Institute

The R@CMon team are currently preparing for the next round of cloud resources uplift in 2021 where “persistent memory” (e.g Intel Optane DC) components are being considered to be included in the resource pool (flavours) available to research cloud users. This could provide even more substantial speedups to big queries on stock price big data. Once ready, the R@CMon team will engage Paul’s team again to utilise these resources.

This article can also be found, published created commons here 1.

iLearn on R@CMon

An integrated platform and meta-learner for feature engineering, machine-learning analysis and modeling of DNA, RNA and protein sequence data : the impact of making machine learning good practice readily available to the community.

Associate Professor Jiangning Song is a long-standing user of the Monash Research Cloud (R@CMon). He is the lead of the Song Lab within the Monash Biomedicine Discovery Institute. Jiangning’s journey began with the deployment of the Protease Specificity Prediction Server – PROSPER app in 2014. Since then the lab has launched more than 30 bioinformatics web services, all of which are made available to research communities worldwide.

Their latest contribution, iLearn, addresses key obstacles to the adoption of machine learning applied to sequencing data. Well-annotated DNA, RNA and protein sequence data is increasingly accessible to all biological researchers. However, at the scale of this data it is challenging if not impossible for an individual to manually investigate. Similarly, another obstacle to broad scale access is that investigation and validation through wet laboratory experiments is time consuming and expensive. Hence when presented appropriately, machine learning can play an import role making higher-level biological data accessible to many researchers in the biosciences.

Many of the previous works and tools only focus on a specific step within a data-processing pipeline. The user is then responsible for chaining these tools together, which in most cases is challenging due to incompatibilities between tools and data formats. iLearn has been designed to address these limitations, using common patterns informed by the lab and its collaborators.

An emerging breakdown of the pipeline steps is:

  • Feature extraction
  • Clustering
  • Normalization
  • Selection
  • Dimensionality reduction
  • Predictor extraction
  • Performance evaluation
  • Ensemble training
  • Results visualisation

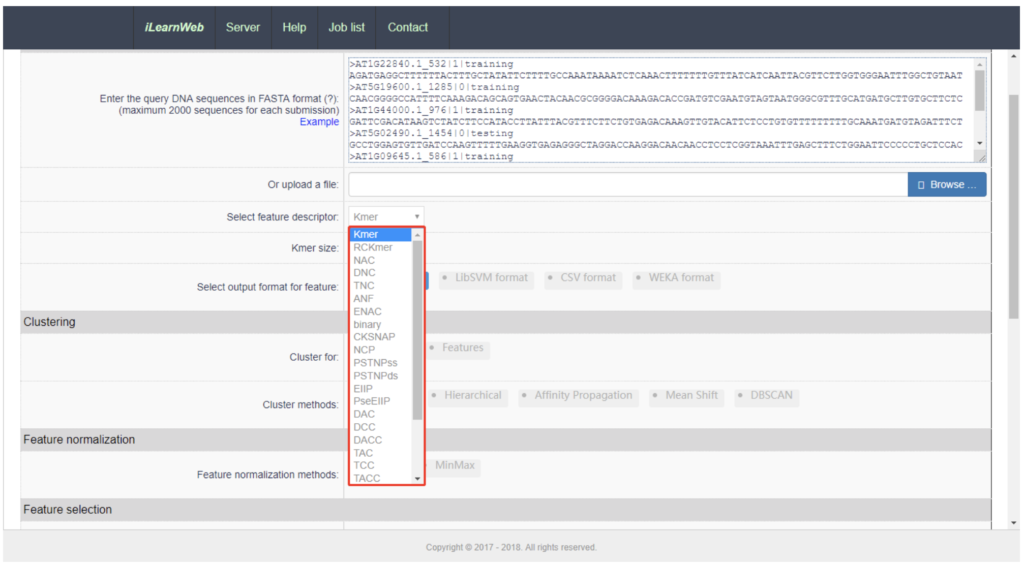
iLearn packages these steps for use in two ways. Users can use iLearn through an online environment (web server) or as a stand-alone python toolkit. Whether your interest is in DNA, RNA or protein analysis, iLearn provides a common workflow pattern for all three cases. Users input their sequence data (normally in FASTA format), and then enters various descriptors and parameters for the analysis.

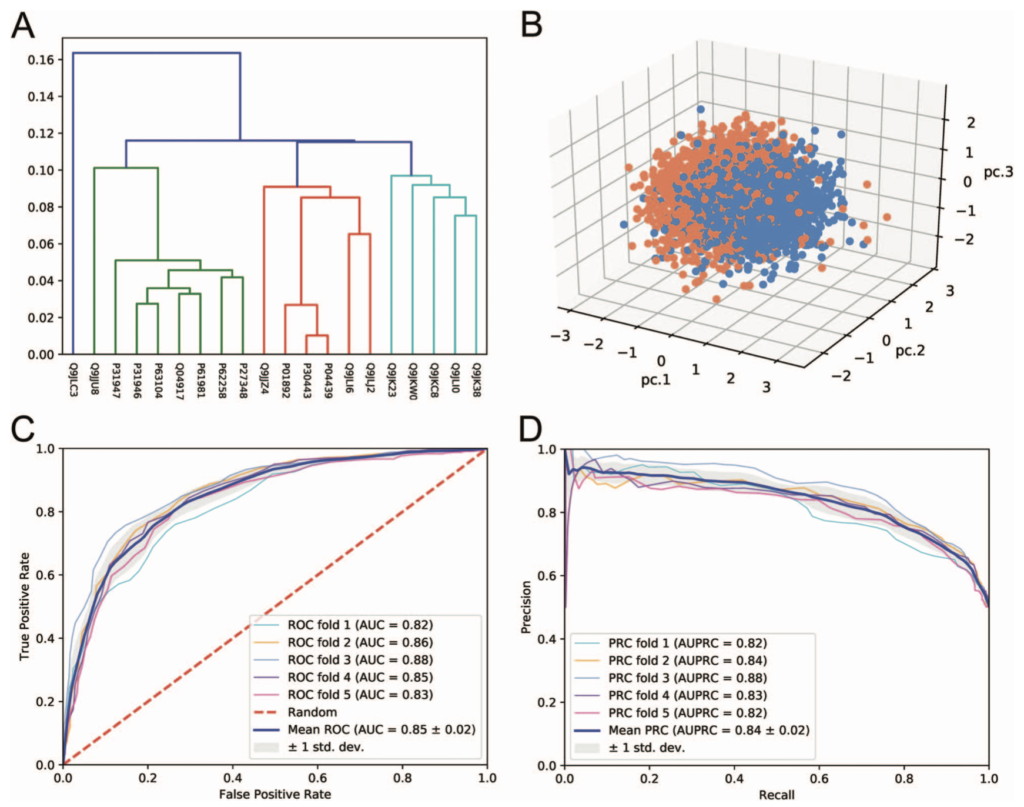
The results page shows the various output, once again informed by the Lab’s good-practices. They can be downloaded from the web server in various formats (e.g CSV, TSV). High quality diagrams and visualisations are also generated by iLearn within the web server:

Since iLearn’s release, more than 5K unique users have used the web server worldwide. The user community and resultant impact continues to grow, with 60 citations since the tool’s seminal publication.

iLearn has been used as an efficient and powerful complementary tool for orchestrating machine-learning-based modelling which in turn improves the speed in biomedical discoveries through genomics and data analysis. As new descriptors get developed and optimised, iLearn aims to incorporate these into future releases to further improve its performance with the R@CMon team providing support to tackle the potential increase in computational and storage complexities.

This article can also be found, published created commons here 1.

Monash Business School Financial Markets Workshop

Last April 30 to May 1, Associate Professor Paul Lajbcygier and Senior Lecturer Huu Nhan Duong from the Monash Business School organised a Financial Markets Workshop at Monash Caulfield Campus, bringing in a number of prominent Australian and international market microstructure researchers as well as high-profile high frequency traders and regulators from the US. The workshop covered several research topics such as “market design and quality”; “high frequency trading”; “volatility and liquidity modelling”; “short selling”; “stock market crashes”; “cryptocurrencies”; and the real effect of financial markets on corporate decisions. The R@CMon team has worked with Paul’s group for several years now, supporting their “big data analysis” workflows on the research cloud. Enabling them to crunch more data, which contributed in several high-impact publications, ARC grant submissions and attainment of a major SEED funding. The international financial workshop event marks the culmination of Paul’s groups accomplishments in high frequency trading research over the years and serves as foundation for future critical mass of research in financial markets. The R@CMon team will continue to support Paul’s group and the Department of Banking and Finance as they work on more high-impact research and in tackling various computational challenges that they may encounter along the journey.

Ceph placement group (PG) scrubbing status

Ceph is our favourite software defined storage system here at R@CMon, underpinning over 2PB of research data as well as the Nectar volume service. This post provides some insight into the one of the many operational aspects of Ceph.

One of the many structures Ceph makes use of to allow intelligent data access as well as reliability and scalability is the Placement Group or PG. What is that exactly? You can find out here, but in a nutshell PGs are used to map pieces of data to physical devices.  One of the functions associated with PGs is ‘scrubbing’ to validate data integrity. Let’s look at how to check the status of PG scrubs.

Let’s find a couple of PGs that map to osd.0 (as their primary):

[admin@mon1 ~]$ ceph pg dump pgs_brief | egrep '\[0,|UP_' | head -5
dumped pgs_brief
PG_STAT STATE UP UP_PRIMARY ACTING ACTING_PRIMARY
57.5dcc active+clean [0,614,1407] 0 [0,614,1407] 0 
57.56f2 active+clean [0,983,515] 0 [0,983,515] 0 
57.55d8 active+clean [0,254,134] 0 [0,254,134] 0 
57.4fa9 active+clean [0,177,732] 0 [0,177,732] 0
[admin@mon1 ~]$

For example, the PG 57.5dcc has an ACTING osd set [0, 614, 1407]. We can check when the PG is scheduled for scrubbing on it’s primary, osd.0:

[root@osd1 admin]# ceph daemon osd.0 dump_scrubs | jq '.[] | select(.pgid |contains ("57.5dcc"))'
{
 "pgid": "57.5dcc",
 "sched_time": "2018-04-11 06:17:39.770544",
 "deadline": "2018-04-24 03:45:39.837065",
 "forced": false
}
[root@osd1 admin]#

Under normal circumstances, the sched_time and deadline are determined automatically by OSD configuration and effectively define a window during which the PG will be next scrubbed. These are the relevant OSD configurables:

[root@osd1 admin]# ceph daemon osd.0 config show | grep scrub | grep interval
 "mon_scrub_interval": "86400",
 "osd_deep_scrub_interval": "2419200.000000",
 "osd_scrub_interval_randomize_ratio": "0.500000",
 "osd_scrub_max_interval": "1209600.000000",
 "osd_scrub_min_interval": "86400.000000",
 [root@osd1 admin]#

[root@osd1 admin]# ceph daemon osd.0 config show | grep osd_max_scrub
 "osd_max_scrubs": "1",
 [root@osd1 admin]#

What happens when we tell the PG to scrub manually?

[admin@mon1 ~]$ ceph pg scrub 57.5dcc
 instructing pg 57.5dcc on osd.0 to scrub
[admin@mon1 ~]$
[root@osd1 admin]# ceph daemon osd.0 dump_scrubs | jq '.[] | select(.pgid |contains ("57.5dcc"))'
 {
 "pgid": "57.5dcc",
 "sched_time": "2018-04-12 17:09:27.481268",
 "deadline": "2018-04-12 17:09:27.481268",
 "forced": true
 }
 [root@osd1 admin]#

The sched_time and deadline have updated to now, and forced has changed to ‘true’. We can also see the state has changed to active+clean+scrubbing:

[admin@mon1 ~]$ ceph pg dump pgs_brief | grep '^57.5dcc'
 dumped pgs_brief
 57.5dcc active+clean+scrubbing [0,614,1407] 0 [0,614,1407] 0
 [admin@mon1 ~]$

Since the osd has osd_max_scrubs configured to 1, what happens if we try to scrub another PG, say 57.56f2:

[root@osd1 admin]# ceph daemon osd.0 dump_scrubs | jq '.[] | select(.pgid |contains ("57.56f2"))'
 {
 "pgid": "57.56f2",
 "sched_time": "2018-04-12 01:45:52.538259",
 "deadline": "2018-04-25 00:57:08.393306",
 "forced": false
 }
 [root@osd1 admin]#

[admin@mon1 ~]$ ceph pg deep-scrub 57.56f2
 instructing pg 57.56f2 on osd.0 to deep-scrub
 [admin@mon1 ~]$

[root@osd1 admin]# ceph daemon osd.0 dump_scrubs | jq '.[] | select(.pgid |contains ("57.56f2"))'
 {
 "pgid": "57.56f2",
 "sched_time": "2018-04-12 17:11:37.908137",
 "deadline": "2018-04-12 17:11:37.908137",
 "forced": true
 }
 [root@osd1 admin]#

[admin@mon1 ~]$ ceph pg dump pgs_brief | grep '^57.56f2'
 dumped pgs_brief
 57.56f2 active+clean [0,983,515] 0 [0,983,515] 0
 [admin@mon1 ~]$

The OSD has updated sched_time, deadline and set ‘forced’ to true as before. But the state is still only active+clean (not scrubbing), because the OSD is configured to process a max of 1 scrub at a time. Soon after the first scrub completes, the second one we initiated begins:

[admin@mon1 ~]$ ceph pg dump pgs_brief | grep '^57.56f2'
 dumped pgs_brief
 57.56f2 active+clean+scrubbing+deep [0,983,515] 0 [0,983,515] 0
 [admin@mon1 ~]$

You will notice after the scrub completes, the sched_time is again updated. The new timestamp is determined by the osd_scrub_min_interval (1 day) and osd_scrub_interval_randomize_ratio (0.5). Effectively, it  randomizes the next scheduled scrub between 1 and 1.5 days since the last scrub:

[root@osd1 admin]# ceph daemon osd.0 dump_scrubs | jq '.[] | select(.pgid |contains ("57.56f2"))'
 {
 "pgid": "57.56f2",
 "sched_time": "2018-04-14 02:37:05.873297",
 "deadline": "2018-04-26 17:36:03.171872",
 "forced": false
 }
 [root@osd1 admin]#

What is not entirely obvious is that a ceph pg repair operation is also a scrub op and lands in the same queue of the primary OSD. In fact, a pg repair is a special kind of deep-scrub that attempts to fix irregularities it finds. For example, lets run a repair on PG 57.5dcc and check the dump_scrubs output:

[root@osd1 admin]# ceph daemon osd.0 dump_scrubs | jq '.[] | select(.pgid |contains ("57.5dcc"))'
{
 "pgid": "57.5dcc",
 "sched_time": "2018-04-14 03:43:29.382655",
 "deadline": "2018-04-26 17:18:37.480484",
 "forced": false
}
[root@osd1 admin]#

[admin@mon1 ~]$ ceph pg dump pgs_brief | grep '^57.5dcc'
dumped pgs_brief
57.5dcc active+clean [0,614,1407] 0 [0,614,1407] 0 
[admin@mon1 ~]$ ceph pg repair 57.5dcc
instructing pg 57.5dcc on osd.0 to repair
[admin@mon1 ~]$ ceph pg dump pgs_brief | grep '^57.5dcc'
dumped pgs_brief
57.5dcc active+clean+scrubbing+deep+repair [0,614,1407] 0 [0,614,1407] 0 
[admin@mon1 ~]$

[root@osd1 admin]# ceph daemon osd.0 dump_scrubs | jq '.[] | select(.pgid |contains ("57.5dcc"))'
{
 "pgid": "57.5dcc",
 "sched_time": "2018-04-13 16:02:58.834489",
 "deadline": "2018-04-13 16:02:58.834489",
 "forced": true
}
[root@osd1 admin]#

This means if you run a pg repair and your PG is not immediately in the repair state, it could be because the OSD is already scrubbing the maximum allowed PGs so it needs to finish those before it can process your PG. A workaround to get the repair processed immediately is to set noscrub and nodeep-scrub, restart the OSD (to stop current scrubs), then run the repair again. This will ensure immediate processing.

In conclusion, the sched_time and deadline from the dump_scrubs output indicate what could be a scrubdeep-scrub, or repair while the forced value indicates if it came from a scrub/repair command.

The only way to tell if next (automatically) scheduled scrub will be a deep-scrub is to get the last deep-scrub timestamp, and work out if osd_deep_scrub_interval will have passed at the time of the next scheduled scrub:

[admin@mon1 ~]$ ceph pg dump | egrep 'PG_STAT|^57.5dcc' | sed -e 's/\([0-9]\{4\}\-[0-9]\{2\}\-[0-9]\{2\}\) /\1@/g' | sed -e 's/ \+/ /g' | cut -d' ' -f1,21
 dumped all
 PG_STAT DEEP_SCRUB_STAMP
 57.5dcc 2018-03-18@03:29:25.128541
 [admin@mon1 ~]$

In this case, the last scrub was almost exactly 4 weeks ago, and the osd_deep_scrub_interval is 2419200 seconds (4 weeks). By the time the next scheduled scrub comes along, the PG will be due for a deep scrub. The dirty sed command above is due to the pg dump output having irregular spacing and spaces in the time stamp 🙂