Tag Archives: Windows

XCMSplus Metabolomics Analysis on R@CMon

At the start of 2017, the R@CMon team had its first user consultation with Dr. Sri Ramarathinam, a research fellow from the Immunproteomics Laboratory (Purcell Laboratory) at the School of Biomedical Sciences in Monash University. Sri and his group at the lab studies metabolomics compounds in various samples by conducting a “search” and “identification” process using a pipeline of analysis and visualisation tools. The lab has acquired the license to use the commercial XCMSPlus metabolomics platform from SCIEX on their workflow. XCMSPlus provides a powerful solution for analysis of untargeted metabolomics data in a stand-alone configuration, which will greatly increase the lab’s capacity to analyse more samples, with faster and easeful results generation and interpretation.

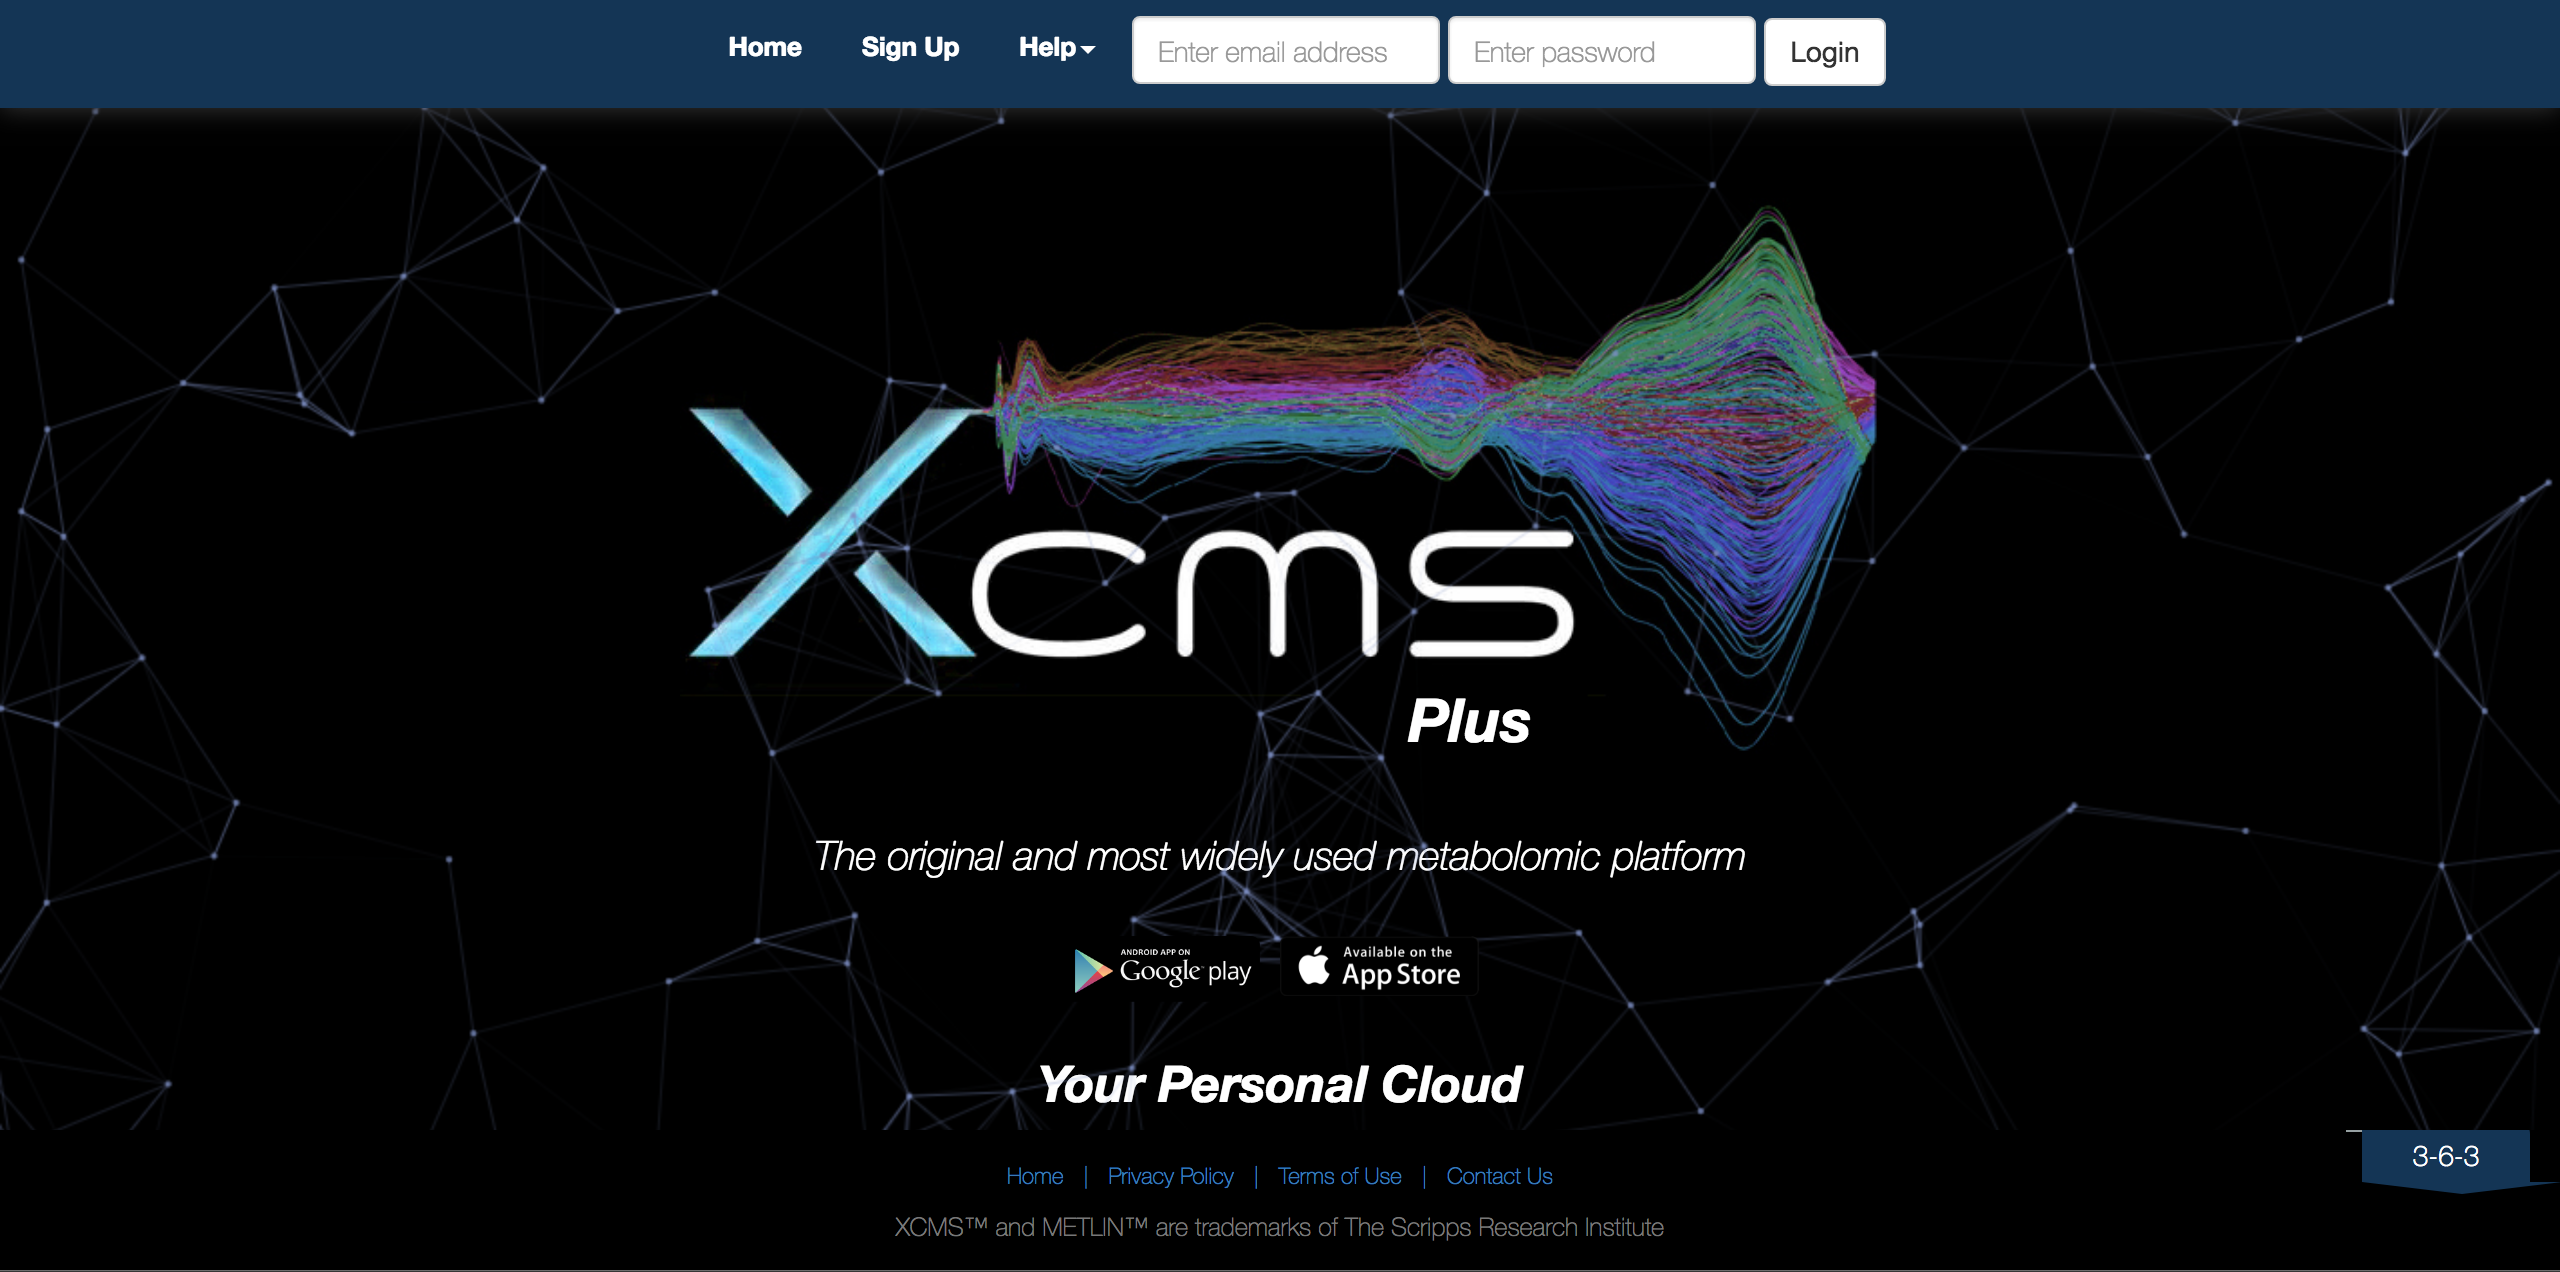
XCMSPlus main login Page, entry point of the complete metabolomics platform

During the first engagement meeting with Sri and the lab, it’s been highlighted that a specialised hosting platform (with appropriate storage and computational capacity) would be required for XCMSPlus. XCMSPlus is distributed as stand-alone appliance (personal cloud) from the vendor. As an appliance, XCMSPlus has been optimised and packaged to be deployed on a single, multi-core and high-memory machine. An added minor complication is that this appliance was distributed in VMWare’s appliance format, which need to be translated into an OpenStack-friendly format. The R@CMon team provided the hosting platform required for XCMSPlus through the Monash node of the Nectar Research Cloud.

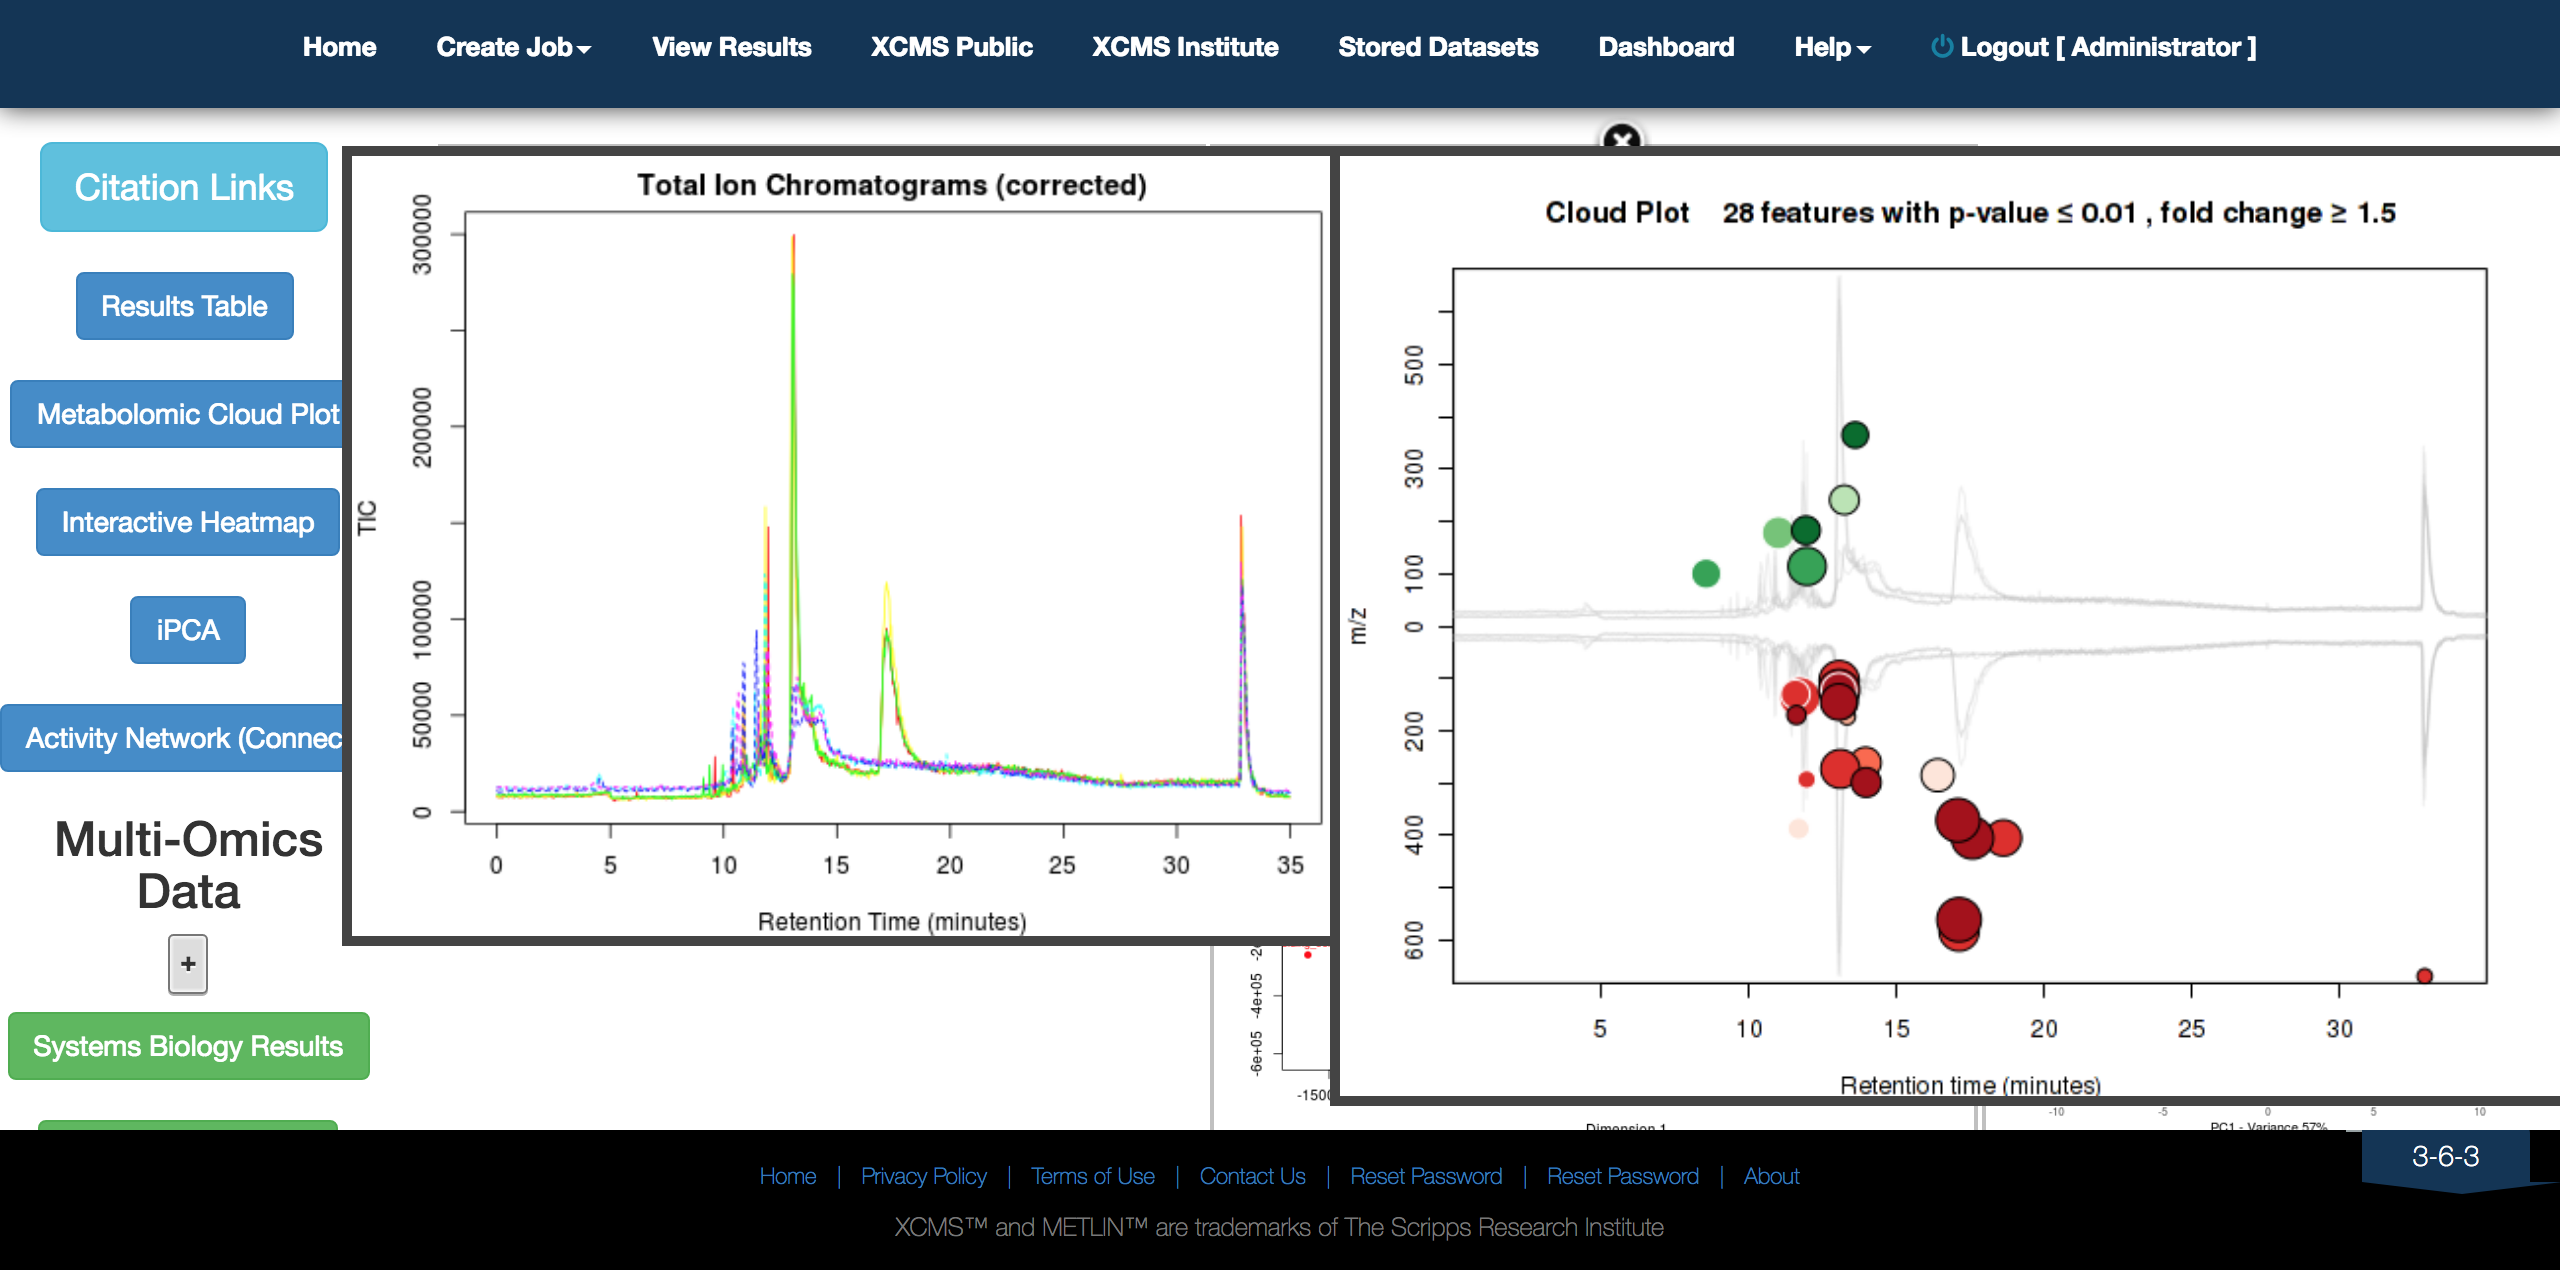
Analysis results and visualisation in XCMSPlus

A dedicated Nectar project has been provisioned for the lab, which is now being used for hosting XCMSPlus. This project also has enough capacity for future expansion and new analysis platform deployments. The now R@CMon-hosted (and supported) XCMSPlus platform for the Immunproteomics Laboratory is the first custom XCMSPlus deployment in Australia. Due to being the first in Australia, there were some early minor issues encountered during its first test runs. These technical issues were eventually sorted out due to collaborative troubleshooting efforts from the R@CM team, the lab and the vendor. And after several months of usage, hundred of jobs submitted and processed by XCMSPlus, and counting, the lab is continuing to fully integrate it as part of their analysis workflow. The R@CMon team is actively engaging with the lab for supporting its adaption of XCMSPlus and planning for future analysis workflow expansions.

Analytical Standard Uncertainty Evaluation on R@CMon

Arvind Rajan is a scholar from the School of Engineering at the Monash University Sunway Malaysia campus. Arvind’s project, “Analytical Uncertainty Evaluation of Multivariate Polynomial”, supported by Monash University Malaysia (HDR scholarship) and the Malaysia Fundamental Research Grant Scheme, extends analytical method of “Guide to the Expression of Uncertainty in Measurement (GUM)” by the development of a systematic framework – the Analytical Standard Uncertainty Evaluation (ASUE) for the analytical standard measurement uncertainty evaluation of non-linear systems. The framework is the first step towards the simplification and standardisation of the GUM analytical method for non-linear systems.

The ASUE Toolbox

The ASUE Toolbox

The R@CMon team supported the ASUE team at Sunway in deploying the framework on the NeCTAR Research Cloud. The project has been given access to the Monash-licensed Windows Server 2012 image and Windows-optimised instance flavour for configuration of the Internet Information Services (IIS) and ASP.NET stack. The ASUE team developed and deployed the framework on NeCTAR using remote desktop access (yes once again – even from overseas!). Mathematica, specifically webMathematica is then used on the NeCTAR instance to power the web-based dynamic ASUE Toolbox. The ASUE toolbox has been published in Measurement, a journal by International Measurement Confederation (IMEKO) and IEEE Access, an open access journal:

Y. C. Kuang, A. Rajan, M. P.-L. Ooi, and T. C. Ong, “Standard uncertainty evaluation of multivariate polynomial,” Measurement, vol. 58, pp. 483-494, Dec. 2014

A. Rajan, M. P. Ooi, Y. C. Kuang, and S. N. Demidenko, “Analytical Standard Uncertainty Evaluation Using Mellin Transform,” Access, IEEE, vol. 3, pp. 209-222, 2015

“The NeCTAR Research Cloud is a great service for researchers to host their own website and share the outcome of their research with engineers, practitioners and other professional community. Honestly, if it is not for the NeCTAR Research Cloud, I doubt our team could have made it this far. The support has been incredible so far. I will continue to publish my work using this service.”

Arvind  Rajan
Monash University Scholar
Electrical and Computer Systems Engineering

MaxQuant Proteomic Searches on R@CMon

David Stroud, NHMRC Doherty Fellow and member of the Ryan Lab from the Department of Biochemistry and Molecular Biology, Monash University does proteomics research and uses the MaxQuant quantitative proteomics software as part of his analysis workflows. MaxQuant is designed for processing high-resolution Mass Spectrometry data and is freely available on the Microsoft Windows platform. Step one in the workflow is to do sample analyses using Liquid chromatography-mass spectrometry (LC-MS) on a Thermo Orbitrap Mass-spectrometer. This step produces raw files containing spectra that represent thousands of peptides. The resulting raw files are then loaded into MaxQuant to perform searches where spectra are compared against known list of peptides. A quantification step is then performed enabling peptide abundance to be compared across samples. Once this process is completed, the resulting tab delimited files are captured for downstream analysis.

Inspection of results using the MaxQuant software.

MaxQuant searches are both CPU and IO intensive tasks. A typical search takes 24 to 48 hours, and in some cases up to a week, depending on the size of the raw files being processed. David has been running his workflow on his own machine with 8 cores, 16 gigabytes of memory (RAM) and a solid state drive (SSD) for storage where a standard search takes 2 to 3 weeks to complete. Performing large MaxQuant searches on the local machine became a struggle, and David needed a bigger machine with a desktop environment to scale up his analysis workflow. The R@CMon team assisted David in deploying the MaxQuant software on the Monash node of the NeCTAR Research Cloud with an m1.xxlarge instance, spawned using the Monash-licensed Windows Server 2012 image. MaxQuant searches on the NeCTAR instance shows a 3-4x speed-up compared to the local machine, what takes several weeks on the local machine now just takes several days on the NeCTAR instance.

Maxquant search of Thermo RAW files.

Maxquant search of Thermo RAW files.

The R@CMon team are currently working with David to explore further scaling options. The high-memory and PCIe SSD-enabled specialist kit on R@CMon Phase 2 can be exploited by MaxQuant for bursting IO intensive activities during searches. More on this coming soon!

Rail Network Catastrophe Analysis on R@CMon

Monash University, through the Institute of Railway Technology (IRT), has been working on a research project with Vale S.A., a Brazilian multinational metals and mining corporation and one of the largest logistical operators in Brazil, to continuously monitor and assess the health of the Carajás Railroad Passenger Train (EFC) mixed-use rail network in Northern Brazil. This project will identify locations that produce “significant dynamic responses” with the aim for proactive maintenance to prevent catastrophic rail failure. As a part of this project, IRT researchers have been involved in (a) the analysis of the collected data and (b) the establishment of a database with visualisation capabilities that allows for the interrogation of the analysed data.
irt-vale-vis-01

GPU-powered DataMap analysis and visualisation on R@CMon.

Researchers use the DataMap analysis software for data interrogation and visualisation. DataMap is a Windows-based client-server tool that integrates data from various measurements and recording systems into a geographical map. Traditionally they have the software running on a commodity laptop with a dedicated GPU connecting to their database server. To scale to larger models, conduct more rigorous analysis and visualisation, as well as support remote collaboration, the system of tools needed to go beyond the laptop.
The R@CMon team supported IRT in deploying the software on the NeCTAR Research Cloud. The deployed instance runs on the Monash-licensed Windows flavours with GPU-passthrough to support DataMap’s DirectX requirements.
irt-vale-vis-02

GPU-powered DataMap analysis and visualisation on R@CMon.

Through the Research Cloud IRT researchers and Vale S.A. counterparts are able to collaborate for modelling, analysis and results using remote access to the GPU-enabled virtual machines.
“The assistance of R@CMon in providing virtual machines that have GPU support, has been instrumental in facilitating global collaboration between staff located at Vale S.A. (Brazil) and Monash University (Australia).”
Dr. Paul Reichl
Senior Research Engineer and Data Scientist
Institute of Railway Technology

Stock Price Impact Models Study on R@CMon Phase 2

Paul Lajbcygier, Associate Professor from the Faculty of Business and Economics, Monash University is studying one of the important changes that affects the cost of trading in financial markets. This change relates to the effects of trading to prices, known as “price impact”, which is brought by wide propagation of algorithmic and high frequency trading and augmented by technological and computational advances. Professor Lajbcygier’s group has recently published new results supported by R@CMon infrastructure and application migration activities, providing new insights into the trading behaviour of so-called “Flash Boys“.

This study uses datasets licensed from Sirca and represents stocks in the S&P/ASX 200 index from year range 2000 to 2014. These datasets are pre-processed using Pentaho and later ingested into relational databases for detailed analysis using advanced queries. Two NeCTAR instances on R@CMon have been used initially in the early stages of the study. One of the instances is used as the processing engine where Pentaho and Microsoft Visual Studio 2012 are installed for pre-processing and post-processing tasks. The second instance is configured as the database server where the extraction queries are executed. Persistent volume storage is used to store reference datasets, pre-processed input files and extracted results. A VicNode merit application for research data storage allocation has been submitted to support the computational access to the preprocessed data supporting the analysis workflow running on the NeCTAR Research Cloud.

Ingestion of pre-processed data into the database running on the high-memory instance, for analysis.

Ingestion of pre-processed data into the database running on the high-memory instance, for analysis.

Initially econometric analyses were done on just the lowest two groups of stocks in the S&P/ASX 200 index. Some performance hiccups were encountered when processing higher frequency groups in the index – some of the extraction queries, which require a significant amount of memory, would not complete when run on the exponentially higher stock groups. The release of R@CMon Phase 2 provided the analysis workflow the capability to attack the higher stock groups using a high-memory instance, instantiated on the new “specialist” kit. Parallel extraction queries are now running on this instance (close to 100% utilisation) to traverse the remaining stock groups from year range 2000 to 2014.

A recent paper by Manh Pham, Huu Nhan Duong and Paul Lajbcygier, entitled, “A Comparison of the Forecasting Ability of Immediate Price Impact Models” has been accepted for the “1st Conference on Recent Developments in Financial Econometrics and Applications”. This paper highlights the results of the examination of the lowest two groups of the S&P/ASX 200 index, i.e., just the initial results. Future research and publications include examination of the upper group of the index based on the latest reference data as they come available and analysis of other price impact models.

This is an excellent example of novel research empowered by specialist infrastructure, and a clear win for a build-it-yourself cloud (you can’t get a 920GB instance from AWS). The researchers are able to use existing and well-understood computational methods, i.e., relational databases, but at much greater capacity than normally available. This has the effect of speeding up initial exploratory work and discovery. Future work may investigate the use of contemporary data-intensive frameworks such as Hadoop + Hive for even larger analyses.

This article can also be found, published created commons here 1.

Spreadsheet of death

R@CMon, thanks to the Monash eResearch Centre’s long history of establishing “the right hardware for research”, prides itself on effectiveness at computing, orchestrating and storing for research. In this post we highlight an engagement that didn’t yield an “effectiveness” to our liking, and how that helped shape elements of the imminent R@CMon phase2.

In the latter part of 2013 the R@CMon team was approached by a visiting student working at the Water Sensitive Cities CRC. His research project involved parameter estimation for an ill-posed problem in ground-water dynamics. He had setup (perhaps partially inherited) an Excel spreadsheet based Monte Carlo engine for this, with a front-end sheet providing input and output to a built in VBA macro for the grunt work – an erm… interesting approach! This had been working acceptably in the small, as he could get an evaluation done within 24 hours on his desktop machine (quad core i7). But now he needed to scale up and run 11 different models, and probably a few times each to tweak the inputs.  Been there yourself?  This is a very common pattern!

Nash-Sutcliffe model efficiency

Nash-Sutcliffe model efficiency (Figure courtesy of eng. Antonello Mancuso, PhD, University of Calabria, Italy)

MCC (the Monash Campus Cluster), our first destination for ‘compute’, doesn’t have any Windows capability, and even if it did, attempting to run Excel in batch mode would have been something new for us. No problem we thought, we’ll use the RC, give him a few big Windows instances and he can spread the calculations across them. Not an elegant or automated solution for sure, but this was a one-off with some tight time constraints, so it was more important to start calculations than get bogged down with a nicer solution.

It took a few attempts to get Windows working properly. We eventually found the handy cloudbase solutions trial image and its guidance documentation. But we also ran into issues activating Windows against the Monash KMS, turns out we had to explicitly select our local network time source as opposed to the default time.windows.com. We also found some problems with the CPU topology that Nova was giving our guests, Windows was seeing multiple sockets rather than multiple cores, which meant desktop variants were out as they would ignore most of the cores.

Soon enough we had a Server 2012 instance ready for testing. The user RDP’d in and set the cogs turning. Based on the first few Monte Carlo iterations (out of the million he needed for each scenario) he estimated it would take about two days to complete a scenario, quite a lot slower than his desktop but still acceptable given the overall scale-out speed up. However, on the third day after about 60 hours compute time he reported it was only 55% complete. Unfortunately that was an unsustainable pace – he needed results within a fortnight – and so with his supervisor they resolved to code and use a different statistical approach (using PEST) that would be more amenable to cluster-computing.

We did some rudimentary performance investigation during the engagement and didn’t find any obvious bottlenecks, the guest and host were always very CPU busy, so it seemed largely attributable to the lesser floating point capabilities of our AMD Bulldozer CPUs. We didn’t investigate deeply in this case and no doubt there could be other elements at play here (maybe Windows was much slower for compute on KVM than Linux), but this is now a pattern we’ve seen with floating point heavy workloads across operating systems and on bare metal. Perhaps code optimisations for the shared FPU in the Bulldozer architecture can improve things, but that’s hardly a realistic option for a spreadsheet.

The AMDs are great (especially thanks to their price) for general purpose cloud usage, that’s why the RC makeup is dominated by them and why commercial clouds like Azure use them. But for R@CMon’s phase2 we want to cater to performance sensitive as well as throughput oriented workloads, which is why we’ve deployed Intel CPUs for this expansion. Monash joins the eRSA and NCI Nodes in offering this high-end capability. More on the composition of R@CMon phase 2 in the coming weeks!

Maya/mental ray Render Farm on R@CMon

Autodesk Maya is a comprehensive software suite that offers 3D computer animation, modelling, simulation, rendering and composition. Maya has been used in various industries to generate 3D assets that are used in film, television, game development and architecture. mental ray is a high performance 3D rendering software for producing highly realistic images using advanced ray tracing techniques. Used by various industry professionals, mental ray has become a standard of photorealistic renderings across many industries.

Tom Chandler, Lecturer, Faculty of Information Technology at Monash University and his team have been using both Maya and mental ray to create highly realistic images and animations for various projects. Their previous render farm was built with traditional desktop machines. As the demand for more resolution, more detail, more frames and more projects continues to increase, they realised that desktop rendering couldn’t provide the capacity and agility to meet their resource requirements. Fortunately Tom heard of a similar render farm the R@CMon team helped in porting into the NeCTAR Research Cloud and then approached us.

The R@CMon team assisted Tom’s team in setting up a Windows Server 2012 environment in the Monash node of the NeCTAR Research Cloud where both Maya and mental ray are installed, licensed and configured. Access to the environment is done using Remote Desktop Connection.

maya-remote-desktop

The Maya 3D animation software, running on a R@CMon-provisioned Windows Server 2012 virtual machine.

Tom’s team started migrating their 3D rendering projects into the Maya/mental ray render farm now running on the NeCTAR Research Cloud. One of these projects is The Visualising Angkor Project – “Visualising Angkor Project” Monash University Faculty of IT, 2013. It is a collaborative project between Monash University and University of Sydney which explores the 3D generation and animation of the Angkor landscapes during the medieval period. The project presents some challenges on how virtual Angkor is interpreted based on archaeological and historical data.

The following is the latest animation rendered on the Maya/mental ray render farm by Tom Chandler’s team for The Visualising Angkor Project – “Visualising Angkor Project” Monash University Faculty of IT, 2013It contains about 1.5 million triangles, 100 materials, 100 textures, and a total of 1275 frames.