Tag Archives: Research Stories

R@CMon Phase 2 is here!

Back in 2012 our submission to NeCTAR planned R@CMon as being delivered in two phases. First a commodity phase, letting the ideals of en masse computing dominate technical choices. We have been operating phase 1 since May 2013. Our new specialist second phase went live in October! R@Cmon phase 2 (R@CMon RDC cell) scales out high-performing and accelerating hardware as driven by the demands of the precinct. Often ‘big data’ is just not possible without ‘big memory’ to hold the problem space without going to disk (x100 slower). Often ‘more memory’ is the barrier, not ‘more cores’. Often ‘I need to interact with a 3D model’. And so on. R@CMon is truly now a scalable and critical mass of self-service, on-demand computing infrastructure. It is also the play-pit where research leaders can build their own 21st century microscopes.

NeCTAR monash-02 rack-rear

One of the four racks of NeCTAR monash-02. From top to bottom: Mellanox 56G switches, management switch, R820 compute nodes, R720 Ceph storage nodes

In addition to phase 1, phase 2 has –

  • 2064 new Intel virtual cores
  • 3 nodes with 1TB of RAM
  • 10 nodes with GPUs for 3d desktops
  • 3 nodes (the large memory ones) with high-performance PCIe SSD
  • All standard compute nodes mix SAS & SSD for low-latency local ephemeral storage
  • All nodes with RDMA (Remote Direct Memory Access – the stuff that makes fast, large-scale, multi-node HPC jobs possible) capable networking

As with phase 1, the entire infrastructure is orchestrated through OpenStack and presented on the Australian Research Cloud. R@CMon is once again pioneering research cloud infrastructure, virtualising all these specialist resources.

Over the next week we’ll blog with emerging examples of GPUs, SSDs and 1TB memory machines…

R820 1TB RAM compute node

One of the specialist nodes – a quad-socket R820 with 1TB RAM and high-performance PCIe-attached flash

Interferome on R@CMon

Interferons (IFNs) were identified as antiviral proteins more than 50 years ago. However, their involvement in immunomodulation, cell proliferation, inflammation and other homeostatic process has since been identified. These cytokines are used as therapeutics in many diseases such as chronic viral infections, cancer and multiple sclerosis. These IFNs regulate the transcription of approximately 2000 genes in a IFN subtype, dose, cell type and stimulus dependent manner. 

Interferome Wordle

Interferome Wordle

Interferome is an online database of IFN regulated genes.  The database is a valuable resource for biomedical researchers, being regularly used by scientists from across the world. This database of IFN regulated genes is an attempt at integrating information from high-throughput experiments to gain a detailed understanding of IFN biology. Interferome enables reliable identification of an individual Interferon Regulated Gene (IRG) or IRG signatures from high-throughput data sets (i.e. microarray, proteomic data etc.). It also assists in identifying regulatory elements, chromosomal location and tissue expression of IRGs in humans and mice.

Interferome Database Statistics

Interferome Database Statistics

The R@CMon team assisted Prof. Paul Hertzog and the Centre of Innate Immunity & Infectious Diseases at MIMR-PHI in migrating versions 1.0 and 2.0 of the Interferome online database into the NeCTAR Research Cloud. Interferome Version 2.0 has quantitative data, more detailed annotation and search capabilities and can be queried for one gene or thousands as in a gene list from a microarray experiment. To ensure availability of data and assist researchers with hypothesis generation and novel biological discoveries, the Interferome database is backed by VicNode Collection 2014R9.06. More information about Interferome is available on the help page.

Bioplatforms Australia – CSIRO NGS Workshop (July 1-3, 2014)

Last July 1-3, 2014, the latest Bioplatforms Australia – CSIRO joint Next Generation Sequencing hands-on workshop was held at the University of New South Wales, Sydney. The workshop was delivered using the established Bioinformatics Training Platform running on the NeCTAR Research Cloud and provided bench biologists and PhD students with NGS training on the following topics:

      • Introduction to the command-line interface – Software Carpentry
      • Introduction to Next Generation Sequencing
      • Illumina Next Generation Sequencing Data Quality
      • Sequence Alignment Algorithms
      • ChIP-Seq Analysis
      • RNA-Seq Analysis
      • de novo Genome Assembly
Sequence data quality analysis and visualisation using FastQC and FASTX-Toolkit.

Sequence data quality analysis and visualisation using FastQC and FASTX-Toolkit.

The R@CMon team helped the workshop organisers in updating the training environment with the latest tools, datasets and other materials as well as ensuring resource stability throughout the 3 day workshop. Future Bioplatforms Australia and CSIRO joint workshops will be announced on the Bioplatforms Australia Training page.

Screen Shot 2014-07-16 at 12.40.46 pm

Alignment visualisation using IGV.

The trainees have the following to say about the workshop:

“The practical component made it 1000 times easier to get my head around the course and I feel like I can be confident in actually applying what I’ve learned (instead of just in lecture format).”

“The beginning with introduction to Unix environment and explanation of the de novo assembly was the best part of the course as the commands were described in more detail so I could understand what the different commands were executing. There was more practical work with the de novo assembly which was good.”

“Hands on experience is good, and the first part on command lines is good for the beginners.”

Spreadsheet of death

R@CMon, thanks to the Monash eResearch Centre’s long history of establishing “the right hardware for research”, prides itself on effectiveness at computing, orchestrating and storing for research. In this post we highlight an engagement that didn’t yield an “effectiveness” to our liking, and how that helped shape elements of the imminent R@CMon phase2.

In the latter part of 2013 the R@CMon team was approached by a visiting student working at the Water Sensitive Cities CRC. His research project involved parameter estimation for an ill-posed problem in ground-water dynamics. He had setup (perhaps partially inherited) an Excel spreadsheet based Monte Carlo engine for this, with a front-end sheet providing input and output to a built in VBA macro for the grunt work – an erm… interesting approach! This had been working acceptably in the small, as he could get an evaluation done within 24 hours on his desktop machine (quad core i7). But now he needed to scale up and run 11 different models, and probably a few times each to tweak the inputs.  Been there yourself?  This is a very common pattern!

Nash-Sutcliffe model efficiency

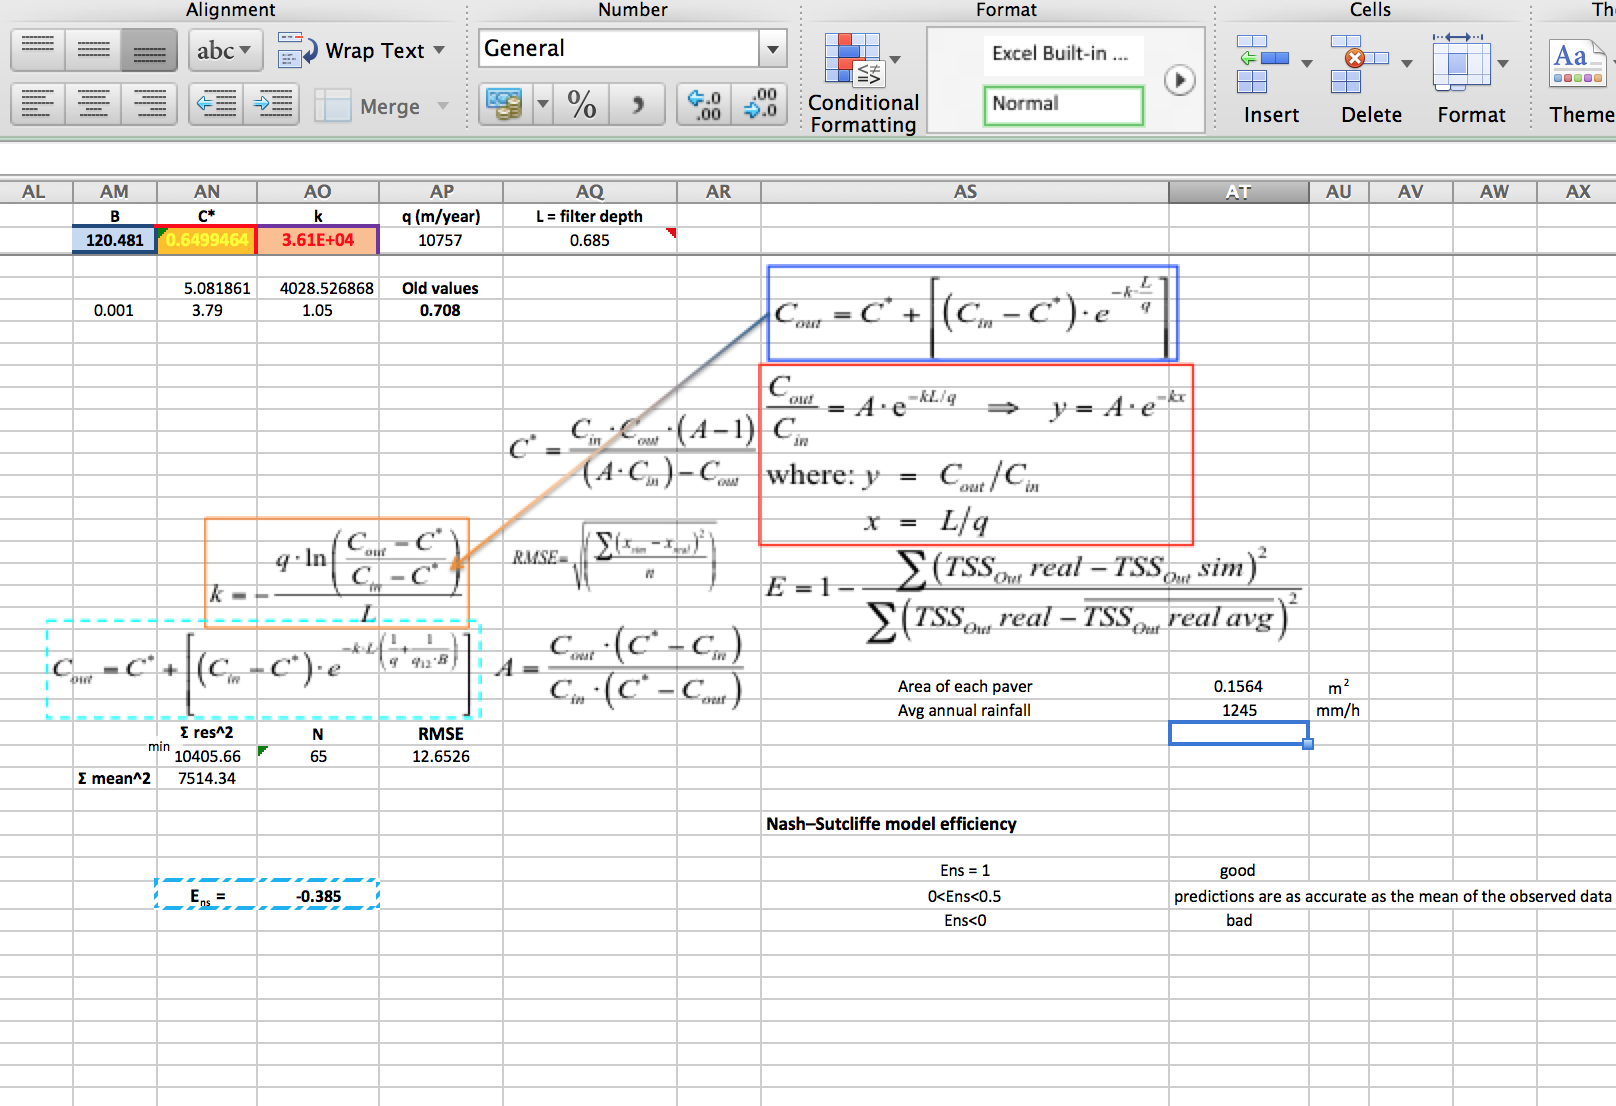
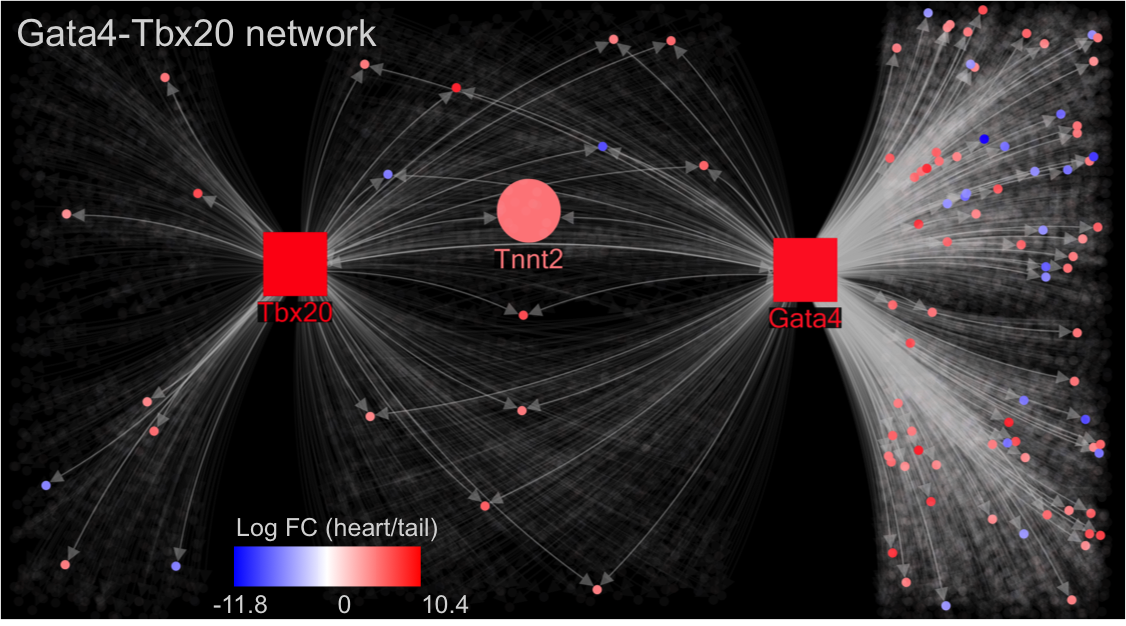
Nash-Sutcliffe model efficiency (Figure courtesy of eng. Antonello Mancuso, PhD, University of Calabria, Italy)

MCC (the Monash Campus Cluster), our first destination for ‘compute’, doesn’t have any Windows capability, and even if it did, attempting to run Excel in batch mode would have been something new for us. No problem we thought, we’ll use the RC, give him a few big Windows instances and he can spread the calculations across them. Not an elegant or automated solution for sure, but this was a one-off with some tight time constraints, so it was more important to start calculations than get bogged down with a nicer solution.

It took a few attempts to get Windows working properly. We eventually found the handy cloudbase solutions trial image and its guidance documentation. But we also ran into issues activating Windows against the Monash KMS, turns out we had to explicitly select our local network time source as opposed to the default time.windows.com. We also found some problems with the CPU topology that Nova was giving our guests, Windows was seeing multiple sockets rather than multiple cores, which meant desktop variants were out as they would ignore most of the cores.

Soon enough we had a Server 2012 instance ready for testing. The user RDP’d in and set the cogs turning. Based on the first few Monte Carlo iterations (out of the million he needed for each scenario) he estimated it would take about two days to complete a scenario, quite a lot slower than his desktop but still acceptable given the overall scale-out speed up. However, on the third day after about 60 hours compute time he reported it was only 55% complete. Unfortunately that was an unsustainable pace – he needed results within a fortnight – and so with his supervisor they resolved to code and use a different statistical approach (using PEST) that would be more amenable to cluster-computing.

We did some rudimentary performance investigation during the engagement and didn’t find any obvious bottlenecks, the guest and host were always very CPU busy, so it seemed largely attributable to the lesser floating point capabilities of our AMD Bulldozer CPUs. We didn’t investigate deeply in this case and no doubt there could be other elements at play here (maybe Windows was much slower for compute on KVM than Linux), but this is now a pattern we’ve seen with floating point heavy workloads across operating systems and on bare metal. Perhaps code optimisations for the shared FPU in the Bulldozer architecture can improve things, but that’s hardly a realistic option for a spreadsheet.

The AMDs are great (especially thanks to their price) for general purpose cloud usage, that’s why the RC makeup is dominated by them and why commercial clouds like Azure use them. But for R@CMon’s phase2 we want to cater to performance sensitive as well as throughput oriented workloads, which is why we’ve deployed Intel CPUs for this expansion. Monash joins the eRSA and NCI Nodes in offering this high-end capability. More on the composition of R@CMon phase 2 in the coming weeks!

VISIONET on R@CMon

VISIONET (Visualizing Transcriptomic Profiles Integrated with Overlapping Transcription Factor Networks) is a visualisation web service for cellular regulatory network studies. It’s been developed as a tool for creating human-readable visualisations of transcription factor networks from user’s microarray and ChiP-seq input data. VISIONET’s node-filtering feature provides a more human-readable large networks visualisation compared to CellDesigner and Cytoscape

Gata4_Tbx20

Gata4-Tbx20 transcription factor network.

R@CMon helped SBI Australia in porting the VISIONET web service into the NeCTAR Research Cloud, enabling rapid development and customisation. VISIONET’s .NET-based framework is now running on a Windows Server 2012 instance inside R@CMon, and it’s now using persistent storage (Volumes) for storing large generated network visualisations. VISIONET is now publicly available to biologists, and user traffic is expected to grow in the near future.